Windows Debugging Tools: Diagnosing and fixing BSODs. Windows Debugging Tools: Diagnosing and Fixing BSODs Creating a Remote Server
These types of failures are usually associated with a failed driver that can be difficult to pinpoint. However, the improved bug tracking system in Windows Vista (and not only in Vista!) can often lead you to a problematic file. As a result, most people stop frantically trying to work on an unstable computer, saving documents with paranoid regularity and hoping for the best.
When Windows crashes, a so-called “memory dump” is usually created. The latter can be investigated with the free Windows Debugging Tools, which can point you to the source of the problem. Therefore, all you need to do is:
Download yourself a debugging tool
You can download Windows Debugging Tools directly from the Microsoft website. The program works with many operating systems, starting with Windows NT 4 and ending with Windows 2008, so you should not have problems with it. Yes, it cannot be said that it is stable under Windows 7 RC, but according to our tests it still works. Therefore, even an attempt to diagnose a problem from under Windows 7 RC may be successful.
Configure your system
During crashes, your computer needs to create memory dumps that will later serve as a source of information for the debugger. Therefore, it is important that Windows is configured to generate dumps. To configure your operating system, right-click on Your computer (Computer) and select Properties (Properties). Then click on the Advanced System Settings tab, on it find the Startup and Recovery Settings subsection and make sure the Write debugging information option is set to Kernel memory dump ) or Complete memory dump.
Next, click Start, go to Programs (All Programs), select Debugging Tools and run WinDbg. In the program, go to the File menu and select Symbol File Path ... Then write the following line in the window that opens:
SRV*c:\symbols*http://msdl.microsoft.com/download/symbols
The latter defines the path to special data - the so-called "symbols" (symbols), which can help the debugging tool in identifying your crashed file.
After entering the string, click the OK button. Later, when working with the debugger, this line will cause the symbols to be downloaded from msdl.microsoft.com and saved to the c:\symbols folder.
Solve your problem
Now wait for another blue screen failure, and the subsequent completion of the computer restart. Then run WinDbg again (Vista users need to run the program as an administrator), click on the File menu, select Open Crash Dump, open the \Windows\MEMORY.DMP file, and the program will immediately begin to analyze it.
Unfortunately, WinDbg provides very little information about what it does, so you might even think that the program is stuck. However, wait. Understand that analyzing, say, 4GB of memory on a not very powerful computer can take some time, up to hours. Therefore, be patient, but rather leave the analysis overnight.
However, usually the result is obtained within a few minutes. This is evidenced by the Bugcheck Analysis line that says something like "Probably caused by: UACReplace.sys". Translated into Russian, this means that the problem is possibly caused by the UACReplace.sys file. Enter it into the search bar, for example, Google and you will find out its real origin. In particular, if it belongs to one of the programs you installed or installed driver, then you can just try to update it or him. Perhaps this will solve your problems.
I must say that from time to time WinDbg cannot name the file at all, or it simply selects one of the Windows DLLs. If this happened to you, then just click on the command window above the status bar and type the command:
After that press Enter. This will provide you with a more detailed report that may contain information about possible reasons your troubles.
If this time you are not lucky, do not despair. Debugging is quite difficult, even for experts. So just close WinDbg and run the analyzer again after the next crash. Perhaps this will give you some more information. Good luck!
To identify the causes of blue screens (BSOD), it is required to analyze the memory dump. In the vast majority of cases, a minidump is enough, which is created by the system in case of critical errors.
This article contains step-by-step instruction for installing and configuring WinDBG - a powerful debugging tool that allows you to identify the true cause of the BSOD.
Step 1 — Setting Up Small Memory Dump Recording
Step 2 — Installing WinDBG
To analyze memory dumps, you will need to install the WinDBG debugger, which is included with the Windows SDK. At the time of writing, the latest available Windows versions SDK:
- Windows 10 SDK (download online installer)
- Windows 8.1 SDK (download online installer)

Step 3 — Mapping .dmp Files to WinDBG
Map your .dmp files to WinDBG to make it easier to read and analyze memory dumps. This will allow you to open dump files from Explorer directly in WinDBG, bypassing its preliminary launch.

Step 4 — Setting Up the Symbol Server to Receive Debug Symbol Files

The installation and initial configuration of WinDBG is now complete. To change it appearance you can go to the menu view- font settings you will find by selecting the item Font, and console window settings in Options.
At the time of a critical failure, the Windows operating system stops working and displays a blue screen of death (BSOD). The contents of RAM and all information about the error that has occurred is written to the paging file. The next time Windows boots, a crash dump is created with debugging information based on the saved data. A fatal error entry is created in the system event log.
Attention! A crash dump is not created if the disk subsystem has failed or if a critical error occurred during the initial stage of Windows boot.
Types of Windows Crash Dumps
Using the current Windows 10 operating system (Windows Server 2016) as an example, let's look at the main types of memory dumps that the system can create:
- Mini memory dump (Small memory dump)(256 KB). This type of file includes a minimum amount of information. It only contains the BSOD error message, information about the drivers, the processes that were active at the time of the crash, and which process or kernel thread caused the crash.
- Kernel memory dump. Typically small, one-third the amount of physical memory. The kernel memory dump is more detailed than the minidump. It contains information about drivers and kernel-mode programs, includes memory allocated to the Windows kernel and the hardware abstraction layer (HAL), and memory allocated to drivers and other kernel-mode programs.
- Complete memory dump. The largest in size and requires memory equal to your system's RAM plus the 1MB required by Windows to create this file.
- Automatic memory dump. Corresponds to a kernel memory dump in terms of information. It differs only in how much space it uses to create the dump file. This file type did not exist in Windows 7. It was added in Windows 8.
- Active memory dump. This type filters out elements that cannot determine the cause of a system failure. This was added in Windows 10 and is especially useful if you're running a virtual machine, or if your system is a Hyper-V host.
How to enable memory dump generation in Windows?
Using Win + Pause, open the system settings window, select " Additional system settings» (Advanced system settings). In the tab " Additionally" (Advanced), section "" (Startup and Recovery), click the button " Options» (Settings). In the window that opens, configure actions in case of system failure. Check the checkbox " Write events to the system log» (Write an event to the system log), select the type of dump to be generated when the system crashes. If in the checkbox " Replace existing dump file» (Overwrite any existing file) check the box, the file will be overwritten on every crash. It is better to uncheck this box, then you will have more information for analysis. Disable also the automatic restart of the system (Automatically restart).
In most cases, a small memory dump will be enough to analyze the cause of the BSOD.

Now, if a BSOD occurs, you can analyze the dump file and find the cause of the failures. A minidump is stored by default in the %systemroot%\minidump folder. To analyze the dump file, I recommend using the program WinDBG(Microsoft Kernel Debugger).
Installing WinDBG on Windows
Utility WinDBG included in " Windows 10 SDK» (Windows 10 SDK). .
The file is called winsdksetup.exe, size 1.3 MB.
Run the installation and choose whether to install the package on this computer or download it for installation on other computers. Install the package on the local computer.

You can install the entire package, but to install only the debug tool select Debugging Tools for Windows.

Once installed, WinDBG shortcuts can be found in the start menu.
Setting the association of .dmp files with WinDBG
To open dump files with a simple click, map the .dmp extension to the WinDBG utility.
- Open command line as administrator and run commands for 64-bit system: cd C:\Program Files (x86)\Windows Kits\10\Debuggers\x64
windbg.exe –IA
for 32-bit system:
C:\Program Files (x86)\Windows Kits\10\Debuggers\x86
windbg.exe –IA - As a result, file types: .DMP, .HDMP, .MDMP, .KDMP, .WEW will be mapped to WinDBG.

Setting up a debug symbol server in WinDBG
Debugging symbols (debug-symbols or symbol files) are data blocks generated in the process of compiling a program together with an executable file. Such data blocks contain information about variable names, called functions, libraries, etc. This data is not needed when running the program, but useful when debugging it. Microsoft components are compiled with symbols distributed through the Microsoft Symbol Server.
Set up WinDBG to use Microsoft Symbol Server:
- Open WinDBG;
- Go to menu file –> Symbol File Path;
- Write a string containing the URL for downloading debug symbols from the Microsoft website and the folder for saving the cache: SRV*E:\Sym_WinDBG*http://msdl.microsoft.com/download/symbols In the example, the cache is downloaded to the E:\Sym_WinDBG folder, you can specify any.
- Don't forget to save changes to the menu file–>Save WorkSpace;
WinDBG will search for symbols in the local folder and, if it does not find the necessary symbols in it, it will automatically download the symbols from the specified site. If you want to add your own symbols folder, you can do it like this:
SRV*E:\Sym_WinDBG*http://msdl.microsoft.com/download/symbols;c:\Symbols
If there is no Internet connection, then download the symbol package from the Windows Symbol Packages resource first.
Crash dump analysis in WinDBG
The WinDBG debugger opens the dump file and loads the necessary symbols for debugging from local folder or from the internet. During this process, you cannot use WinDBG. At the bottom of the window (in the debugger command line) appears the inscription Debugee not connected.
Commands are entered into the command line located at the bottom of the window.

The most important thing to pay attention to is the error code, which is always specified in hexadecimal value and looks like 0xXXXXXXXXX(indicated in one of the options - STOP:, 07/02/2019 0008F, 0x8F). In our example, the error code is 0x139.
The debugger prompts you to execute the command! analyze -v, just hover over the link and click. What is this command for?
- It performs a preliminary analysis of the memory dump and provides detailed information to start the analysis.
- This command will display the STOP code and the symbolic name of the error.
- It shows the call stack of the commands that led to the crash.
- In addition, IP address, process, and register faults are displayed here.
- The team can provide ready-made recommendations for solving the problem.
The main points that you should pay attention to when analyzing after executing the !analyze -v command (the listing is not complete).
1: kd> !analyze -v
* *
*Bugcheck Analysis*
* *
*****************************************************************************
Symbolic name of the STOP error (BugCheck)
KERNEL_SECURITY_CHECK_FAILURE (139)
Description of the error (A kernel component has corrupted a critical data structure. This corruption could potentially allow an attacker to take control of this machine):
A kernel component has corrupted a critical data structure. The corruption could potentially allow a malicious user to gain control of this machine.
Error arguments:
Arguments:
Arg1: 0000000000000003, A LIST_ENTRY has been corrupted (i.e. double remove).
Arg2: ffffd0003a20d5d0, Address of the trap frame for the exception that caused the bugcheck
Arg3: ffffd0003a20d528, Address of the exception record for the exception that caused the bugcheck
Arg4: 0000000000000000, Reserved
Debugging Details:
------------------
The counter shows how many times the system crashed with a similar error:
CUSTOMER_CRASH_COUNT: 1
DEFAULT_BUCKET_ID: FAIL_FAST_CORRUPT_LIST_ENTRY
STOP error code in abbreviated format:
BUGCHECK_STR: 0x139
The process that crashed (not necessarily the cause of the error, just that process was running in memory at the time of the crash):
PROCESS_NAME: sqlservr.exe
Error code decryption: The system has detected a stack buffer overflow in this application, which may allow an attacker to take control of this application.
ERROR_CODE: (NTSTATUS) 0xc0000409 - The system detected an overrun of a stack-based buffer in this application. This overrun could potentially allow a malicious user to gain control of this application.
EXCEPTION_CODE: (NTSTATUS) 0xc0000409 - The system detected an overrun of a stack-based buffer in this application. This overrun could potentially allow a malicious user to gain control of this application.
Last call on the stack:
LAST_CONTROL_TRANSFER: from fffff8040117d6a9 to fffff8040116b0a0
Call stack at the time of failure:
STACK_TEXT:
ffffd000`3a20d2a8 fffff804`0117d6a9: 00000000`00000139 00000000`00000003 ffffd000`3a20d5d0 ffffd000`3a20d528: nt!KeBugCheckEx
ffffd000`3a20d2b0 fffff804`0117da50: ffffe000`f3ab9080 ffffe000`fc37e001 ffffd000`3a20d5d0 fffff804`0116e2a2: nt!KiBugCheckDispatch+0x69
ffffd000`3a20d3f0 fffff804`0117c150: 00000000`00000000 00000000`00000000 00000000`00000000 00000000`00000000: nt!KiFastFailDispatch+0xd0
ffffd000`3a20d5d0 fffff804`01199482: ffffc000`701ba270 ffffc000`00000001 000000ea`73f68040 fffff804`000006f9: nt!KiRaiseSecurityCheckFailure+0x3d0
ffffd000`3a20d760 fffff804`014a455d: 00000000`00000001 ffffd000`3a20d941 ffffe000`fcacb000 ffffd000`3a20d951: nt! ?? ::FNODOBFM::`string"+0x17252
ffffd000`3a20d8c0 fffff804`013a34ac: 00000000`00000004 00000000`00000000
ffffd000`3a20d990 fffff804`0117d313: ffffffff`fffffffe 00000000`00000000 00000000`00000000 000000eb`a0cf1380: nt!NtWriteFile+0x694
ffffd000`3a20da90 00007ffb`475307da: 00000000`00000000 00000000`00000000 00000000`00000000 00000000`00000000: nt!KiSystemServiceCopyEnd+0x13
000000ee'f25ed2b8 00000000'00000000: 00000000'00000000 00000000'00000000 00000000'00000000
The section of code where the error occurred:
FOLLOWUP_IP:
nt!KiFastFailDispatch+d0
fffff804`0117da50 c644242000 mov byte ptr ,0
FAULT_INSTR_CODE: 202444c6
SYMBOL_STACK_INDEX: 2
SYMBOL_NAME: nt!KiFastFailDispatch+d0
FOLLOWUP_NAME: MachineOwner
The name of the module in the kernel object table. If the analyzer was able to detect a problematic driver, the name is displayed in the MODULE_NAME and IMAGE_NAME fields:
MODULE_NAME: nt
IMAGE_NAME: ntkrnlmp.exe
1: kd > lmvm nt
Browse full module list
Loaded symbol image file: ntkrnlmp.exe
Mapped memory image file: C:\ProgramData\dbg\sym\ntoskrnl.exe\5A9A2147787000\ntoskrnl.exe
Image path: ntkrnlmp.exe
Image name: ntkrnlmp.exe
InternalName: ntkrnlmp.exe
OriginalFilename: ntkrnlmp.exe
ProductVersion: 6.3.9600.18946
FileVersion: 6.3.9600.18946 (winblue_ltsb_escrow.180302-1800)

In the example above, the analysis pointed to the kernel file ntkrnlmp.exe. When memory dump analysis points to a system driver (for example, win32k.sys) or a kernel file (as in our example, ntkrnlmp.exe), that file is most likely not the cause of the problem. Very often it turns out that the problem lies in the device driver, BIOS settings, or hardware malfunction.
If you see that the BSOD is due to a third party driver, its name will be listed in the MODULE_NAME and IMAGE_NAME values.
For example:
Image path: \SystemRoot\system32\drivers\cmudaxp.sys
Image name: cmudaxp.sys
Open the properties of the driver file and check its version. In most cases, the problem with the drivers is solved by updating them.
Debugging Tools for Windows- Operating code debugging tools Windows systems. They are a set of freely distributed programs from Microsoft designed for debugging user-mode and kernel-mode code: applications, drivers, services, kernel modules. The toolkit includes console and GUI debuggers, utilities for working with symbols, files, processes, utilities for remote debugging. The toolkit contains utilities with which you can find the causes of failures in various components of the system. Debugging Tools for Windows from a certain moment are not available for download in the form of a standalone distribution and are part of the Windows SDK (Windows Software Development Kit). Instrumental set Windows Tools The SDK, in turn, is available as part of the MSDN Subscription Program, or can be freely downloaded as a separate distribution from msdn.microsoft.com. According to the developers, the latest and greatest current version Debugging Tools for Windows is contained in the Windows SDK.
Debugging Tools for Windows are updated and made available to the public quite often, and this process does not depend on the release of operating systems. Therefore, periodically check for new versions.
Let's now see what, in particular, the Debugging Tools for Microsoft Windows allow us to do:
- Debugging local applications, services (services), drivers and kernel;
- Debug remote applications, services (services), drivers and the kernel over the network;
- Debug running applications in real time;
- Analyze memory dump files of applications, the kernel and the system as a whole;
- Work with systems based on x86/x64/Itanium architectures;
- Debug user-mode and kernel-mode programs;
The following versions of Debugging Tools for Windows are available: 32-bit x86, Intel Itanium, 64-bit x64. We need two of them: x86 or x64.
There are several ways to install Debugging Tools for Windows, in this article we will consider only the main ones:
- Installation via web installer.
- Installing Debugging Tools for Windows from the Windows SDK ISO.
- Installing Debugging Tools for Windows directly from the dbg_amd64.msi /dbg_x86.msi packages.
It remains unclear at what point, why should I install debugging tools on a computer? Often, after all, you come across a situation where intervention in the working environment is extremely undesirable! And even more so since the installation of a new product, that is, making changes to the registry / system files, may be completely unacceptable. Mission-critical servers are examples. Why don't developers consider portable versions of applications that don't require installation?
From version to version, the process of installing the Debugging Tools for Windows package undergoes some changes. Let's now jump straight into the installation process and look at the ways in which the toolkit can be installed.
Installing Debugging Tools for Windows Using the Web Installer
Go to the Windows SDK Archive page and find a section called Windows 10 and below the item "Windows 10 SDK (10586) and Microsoft Windows 10 Mobile Device Emulator (version 10586.11)".
Click on an item INSTALL SDK. After clicking, download and run the sdksetup.exe file, which initiates the process of online installation of the Windows SDK. At the initial stage, the installer will check if the .NET Framework package is installed on the system latest version(currently it is 4.5). If the package is missing, the installation will be offered and the station will be rebooted when finished. Immediately after the reboot, at the stage of user authorization, the installation process starts directly with the Windows SDK.

Often, when choosing all the components of the package without exception, errors may occur during the installation process. In this case, it is recommended to install components selectively, the minimum required set.
After the installation of Debugging Tools for Windows is complete, the location of the debug files with this installation method will be as follows:
- 64-bit versions: C:\Program Files (x86)\Windows Kits\x.x\Debuggers\x64
- 32-bit versions: C:\Program Files (x86)\Windows Kits\x.x\Debuggers\x86
* where x.x is a specific version of the development kit;
Have you noticed that versions 8 and higher, the installation paths are noticeably different from the classic ones for all previous versions of debugging tools?
A huge advantage of this method of installing Debigging Tools for Windows is the installation of versions of debugging tools for all architectures at once.
Installing Debugging Tools for Windows from the Windows SDK ISO
This method involves installing Debugging Tools for Windows using the full Windows SDK (Software Developers Kit) installation image. Until a certain time, you could download the ISO image for the corresponding system on the Windows SDK Archive page. However, at the moment, you can get an ISO image of the SDK by running the web installer sdksetup.exe , and selecting the item Download the Windows Software Development Kit in the start window of the installer:
As it was found out, the previous installation method using the web installer is quite capricious and often fails. On clean systems, it installs without problems, but on sufficiently loaded systems, numerous problems arise. If this is the case for you, then use this method.
Accordingly, on the page you need to select the required distribution kit, for me (and I think for many) at the moment it is "Windows SDK for Windows 7 and .NET Framework 4" and just below click on the link "Get DVD ISO image" .
When working with the site msdn.microsoft.com, I advise you to use a browser internet explorer, because there have been observed cases of non-working of competing products!
Accordingly, it is necessary to choose only as necessary. Usually the bitness of Debugging Tools for Windows is the same as the bitness of the system. My test systems are mostly 64-bit, so in most cases I download the image for the 64-bit system GRMSDKX_EN_DVD.iso .
Then, after downloading the image, we need to somehow work with the existing ISO image. The traditional way is, of course, burning a CD, but this is a rather long and sometimes costly method. I propose to use free utilities to create virtual disk devices in the system. Personally, I prefer to use the DEAMON Tools Lite program for this purpose. Someone may have other preferences, more direct or lightweight utilities, in taste and color, as they say .. After installing DAEMON Tools Lite, I simply double-click on the GRMSDKX_EN_DVD.iso image file and I have a new virtual compact disc:

Then, by double-clicking, I activate autoload and start the installation of the Windows SDK:

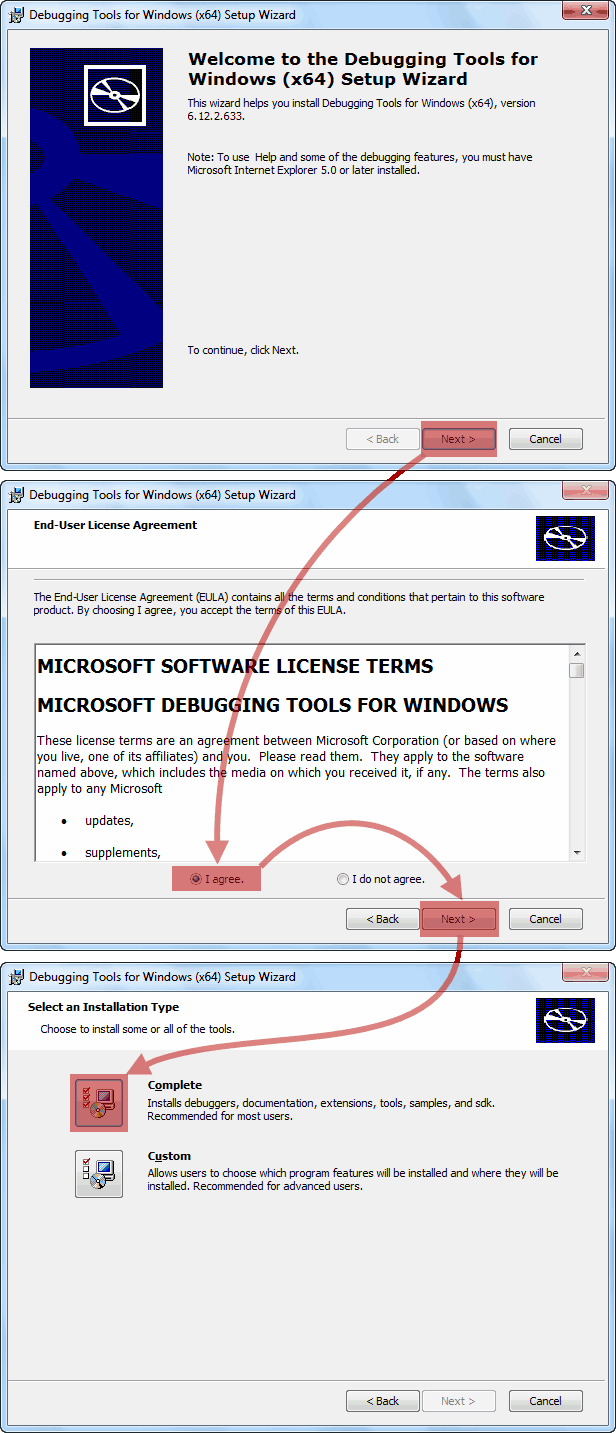
When the turn comes to select the components to be installed from the list, we disable absolutely all options except those marked in the screenshot. This will help us avoid unnecessary mistakes now.

That's right, the screenshot shows two options: "Windows Performance Toolkit" and "Debugging Tools for Windows". Choose both, because the Windows Performance Toolkit will certainly come in handy in your work! Further, after clicking the "Next" button, the installation continues in the normal mode. And at the end you will see the inscription "Installation Complete".
Upon completion of the installation, the working directories of the Debugging Tools for Windows kit will be as follows:
- For x86 version:
- For x64 version:
This completes the installation of Debugging Tools for Windows.
Installing Debugging Tools for Windows via .msi file
In case of problems during the installation of Debugging Tools for Windows in the two previous ways, we still have one more, the most reliable and time-tested, which has helped out, so to speak, more than once. Once, before integration into the Windows SDK, Debugging Tools for Windows were available as a separate .msi installer, which can still be found, but already in the bowels of the Windows SDK distribution. Since we already have an ISO image of the Windows SDK on hand, we can not mount it into the system, but simply open it using the well-known WinRAR archiver, or any other product that works with the contents of ISO disks.

After opening the image, we need to go to the "Setup" directory located at the root and then select one of the directories:
- To install the 64-bit version: \Setup\WinSDKDebuggingTools_amd64 and unpack the dbg_amd64.msi file from this directory.
- To install the 32-bit version: \Setup\WinSDKDebuggingTools and unpack the dbg_x86.msi file from this directory.
Upon completion of the installation, the working directories of the Debugging Tools for Windows kit will be as follows:
- For x86 version: C:\Program Files (x86)\Debugging Tools for Windows (x86)
- For x64 version: C:\Program Files\Debugging Tools for Windows (x64)
At this point, the installation of Debugging Tools for Windows can be considered completed.
additional information
I don't know what it is connected with, maybe with my carelessness, but after installing the Debugging Tools for Windows, the installer does not set the path to the directory with the debugger in the Path system path variable. This imposes certain restrictions on running various debugging tasks directly from the console. Therefore, in the absence of a path, I myself write in the window Environment Variables path to debugging tools:
- C:\Program Files (x86)\Windows Kits\10\Debuggers\x86
- C:\Program Files (x86)\Windows Kits\10\Debuggers\x64
* In your case, the paths may differ both due to the use of an OS of a different bitness, and due to the use of an SDK of a different version.
The utilities of the Debugging Tools for Windows package can work as portable applications, you just need to copy the directory from the working system Microsoft Windows Performance Toolkit and use it as a portable version on a production server. But do not forget to take into account the capacity of the system !! Even if you have made a complete installation of the package on a critical system, then you can start working right after installation, no reboot is required.
Debugging Tools for Windows
And now, finally, here is the composition of Debugging Tools for Windows:
| File | Purpose |
|---|---|
| adplus.doc | Documentation for the ADPlus utility. |
| adplus.exe | A console application that automates the work of the cdb debugger to create dumps, log files for one or more processes. |
| agestore.exe | A utility for deleting obsolete files from the storage used by the symbol server or source server. |
| breakin.exe | A utility that allows you to send a custom break combination to processes, similar to pressing CTRL+C. |
| cdb.exe | User mode console debugger. |
| convertstore.exe | Utility to convert characters from 2-tier to 3-tier. |
| dbengprx.exe | Ripiter (proxy server) for remote debugging. |
| dbgpc.exe | A utility for displaying information about the status of an RPC call. |
| dbgsrv.exe | The server process used for remote debugging. |
| dbh.exe | A utility for displaying information about the contents of a symbol file. |
| dumpchk.exe | Dump verification utility. A utility for quickly checking a dump file. |
| dumpexam.exe | A utility for analyzing a memory dump. The result is output to %SystemRoot%\MEMORY.TXT . |
| gflags.exe | Editor of global system flags. The utility manages registry keys and other settings. |
| i386kd.exe | Wrapper for kd. Was that what kd was once called for Windows NT/2000 based systems for x86 machines? Probably left for compatibility reasons. |
| ia64kd.exe | Wrapper for kd. Was that what kd was once called for Windows NT/2000 based systems for ia64 machines? Probably left for compatibility reasons. |
| kd.exe | Kernel-mode console debugger. |
| kdbgctrl.exe | Kernel debug management tool. Utility for managing and configuring the kernel debugging connection. |
| kdsrv.exe | Connection server for KD. The utility is a small application that runs and waits for remote connections. kd runs on a client and connects to that server for remote debugging. Both server and client must be from the same Debugging Tools assembly. |
| kill.exe | Utility to end processes. |
| list.exe | A utility for displaying the contents of a file on the screen. This miniature utility was bundled with one purpose - viewing large text or log files. It takes up little space in memory, because it loads the text in parts. |
| logger.exe | A tiny debugger that can only work with one process. The utility injects logexts.dll into the process space, which records all function calls and other actions of the program being examined. |
| logviewer.exe | A utility for viewing logs written by the logger.exe debugger. |
| ntsd.exe | Microsoft NT Symbolic Debugger (NTSD). A debugger that is identical to cdb, except that it creates a text window on startup. Like cdb, ntsd is capable of debugging both console applications and graphical applications. |
| pdbcopy.exe | A utility for removing private symbols from a symbol file, controlling public symbols included in a symbol file. |
| remote.exe | Utility for remote debugging and remote control of any KD, CDB and NTSD console debugger. Allows you to run all these console debuggers remotely. |
| rtlist.exe | Remote Task Viewer. The utility is used to list running processes through the DbgSrv server process. |
| symchk.exe | A utility to download symbols from the Microsoft symbol server and create a local symbol cache. |
| symstore.exe | Utility for creating network or local storage of symbols (2-tier/3-tier). A symbol store is a specialized directory on disk that is built according to a certain structure and contains symbols. In the root directory of the symbols, a subfolder structure is created with names identical to the names of the components. In turn, each of these subfolders contains nested subfolders with special names obtained by hashing binary files. The symstore utility scans component folders and adds new components to the symbol store where any client can retrieve them. The symstore is said to be used to get symbols from the 0-tier storage and put them into the 2-tier/3-tier storage. |
| tlist.exe | Task Viewer. A utility for listing all running processes. |
| umdh.exe | User-mode dump heap utility. A utility for analyzing heaps of a selected process. Allows you to display various options for the heap. |
| usbview.exe | USB viewer. utility to view USB devices connected to a computer. |
| vmdemux.exe | Virtual Machine Demultiplexer. Creates multiple named pipes for a single COM connection. Channels are used to debug various components of the virtual machine |
| windbg.exe | User mode and kernel mode debugger with GUI. |
To identify the causes of blue screens (BSOD), it is required to analyze the memory dump. In the vast majority of cases, a minidump is enough, which is created by the system in case of critical errors.
This article provides step by step instructions for installing and configuring WinDBG, a powerful debugging tool that allows you to identify the true cause of a BSOD.
Step 1 — Setting Up Small Memory Dump Recording
Step 2 — Installing WinDBG
To analyze memory dumps, you will need to install the WinDBG debugger, which is included with the Windows SDK. At the time of writing, the latest available versions of the Windows SDK are:
- Windows 10 SDK (download online installer)
- Windows 8.1 SDK (download online installer)
Step 3 — Mapping .dmp Files to WinDBG
Map your .dmp files to WinDBG to make it easier to read and analyze memory dumps. This will allow you to open dump files from Explorer directly in WinDBG, bypassing its preliminary launch.
Step 4 — Setting Up the Symbol Server to Receive Debug Symbol Files
The installation and initial configuration of WinDBG is now complete. In order to change its appearance, you can go to the menu view- font settings you will find by selecting the item Font, and console window settings in Options.


